Last week, we rolled out a new survey to gather input from our users on www.fiu.edu, and we’re looking forward to the feedback. It’s been a while since our last survey back in 2017, and we learned so much from that experience.
Why are we conducting a survey on FIU.edu?
As we gear up for another website redesign, we want to make sure we're giving our users the best experience possible. That’s where their feedback comes in.
This online survey is designed to help us understand how we could make our users' web experience better. Before diving in, we needed to identify our goals for the survey, so we can focus on what matters most.
Survey Goals
Who is our post-pandemic audience?
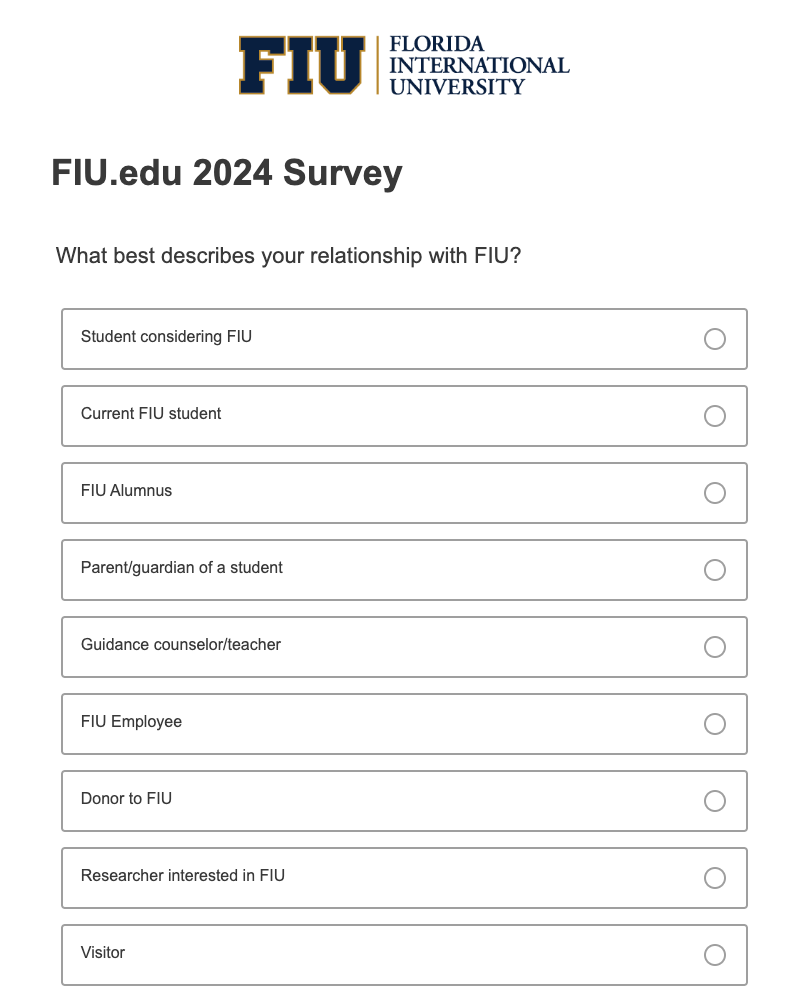
Back in 2017 we identified the largest groups of FIU users were students considering FIU and cCurrent students. A lot has changed since 2017 and the pandemic. We need to know if our audience has changed as well.
What format do users prefer for consuming information from the page they visited?
With the rise of social media and advancing technologies, it’s important for us to understand whether our users’ expectations have evolved as well. Do they prefer engaging visuals, catchy videos, downloadable documents or interactive elements? Knowing their preferences will help us create a new experience that better meets their needs.
Determine the best photos and videos to use on FIU.edu.
From our research, we know one of the top questions prospective students ask themselves when looking into a university is, “Will I fit in?” Seeing someone like you in our photos or videos can really resonate. It helps create a connection and makes a difference when users can see themselves represented at FIU. Whether it's photos of sporting events, students in the classroom or showcasing student achievements they’d like to see, we want to know.
What information do FIU.edu users want to see on a program page?
Choosing a degree program is a big decision, and it can be a stressful process. To create effective program pages, we need to understand what’s most important to users when they’re exploring their options. What information do they need to make that decision easier? We're gathering this information through display logic in Qualtrics, which allows us to directly ask students considering FIU and current students what they are looking for in a program page.
How did we come up with the survey questions and prompt?
After we set our survey goals, the next step was to come up with the questions. We figured that 10 questions would be just right – enough to keep it quick and engaging, but still allowing us to gather meaningful feedback. We wanted to make sure our users didn’t feel rushed, as too many questions could lead to less thoughtful responses.
When we were writing the questions we tried to minimize bias. The NNGroup has a great article on writing good survey questions. We followed their best practices:
- Ask only questions that you need answered
- Use language that is neutral, natural, and clear
- Don’t ask respondents to predict behavior
- Focus on closed-ended questions
- Avoid asking questions that cover multiple topics
- Use balanced scales
- Provide an opt-out
- Allow most questions to be optional

Choosing a survey tool
We chose to use Qualtrics for our survey. Qualtrics is easy to use, embeddable and available for free to FIU staff.
While we typically use FIU Webforms for our forms, we found Qualtrics is better suited for filtering, compiling and visualizing the results of a survey.
Every survey needs a prompt
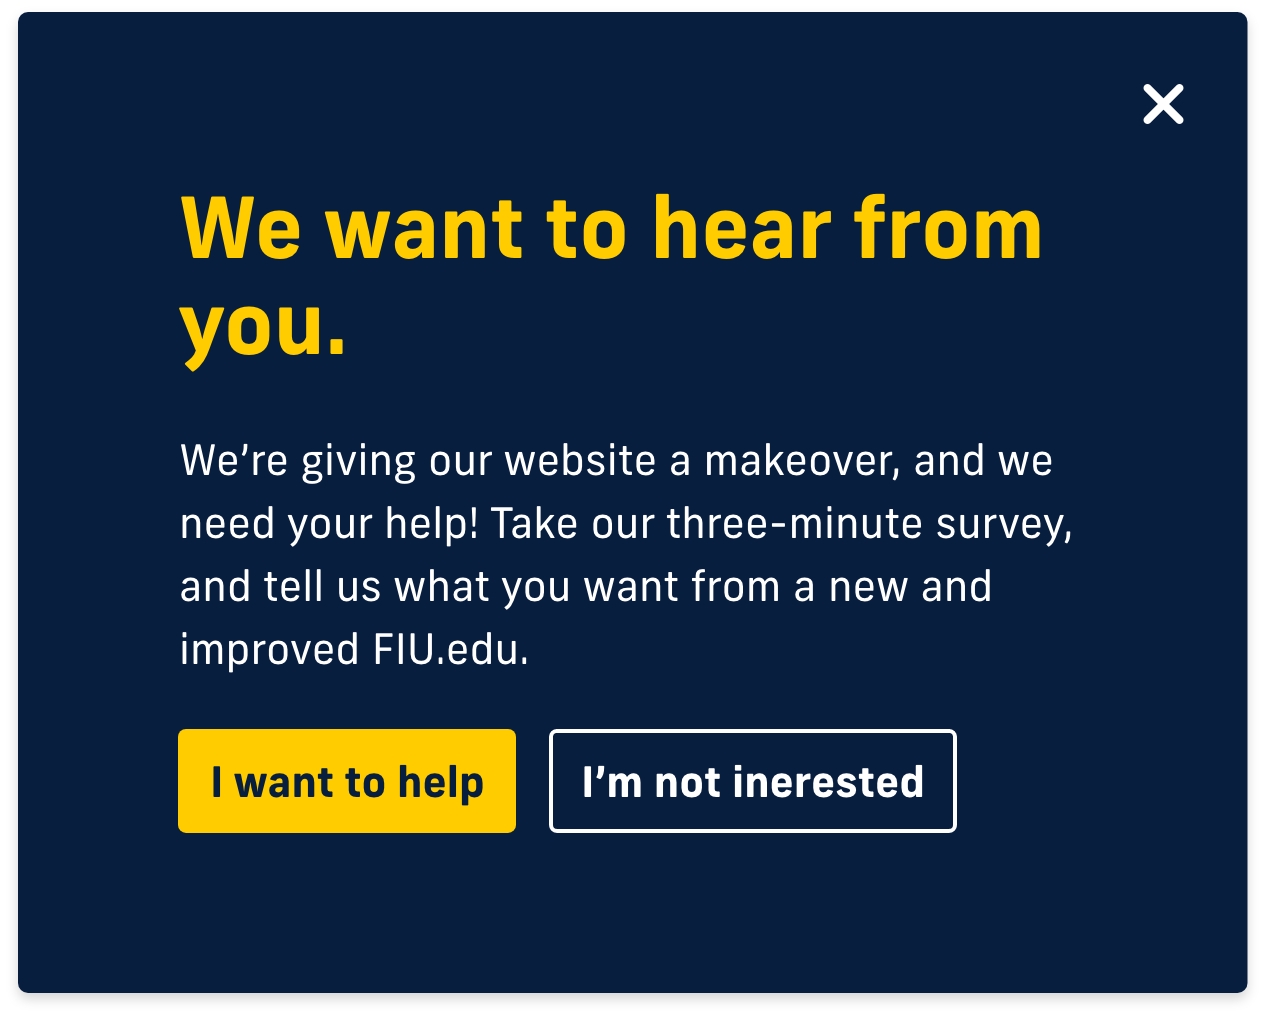
When writing our survey prompt, we aimed for a clear and straightforward headline, along with a brief description that explains what we’re doing and how long the survey will take.
We added a primary (yellow) button for users to click if they wanted to participate, prompting them to start the survey. A secondary (outline) button was also provided for those who wanted to opt out.

How long is the survey running?
We’re keeping the survey open for the equivalent of a full semester, running from October 23, 2024, to February 24, 2025.
When it ends, we’ll take it down from the website and start compiling the results.
What can you expect when we share the results?
Once we wrap up the survey, we’ll put together all the findings and share them with everyone.

